Sales forecasting is an underrated skill for founders.
As an early-stage founder, it can be hard to imagine yourself walking into a Wall Street boardroom for a shareholders meeting to confidently predict how much revenue you’re going to close every quarter.
In the early days, this might feel unattainable or frivolous—you’re just trying to build a great product. Sales will come later.
But learning how to monitor and predict your sales can help you in your quest to build a great product. You can learn which customer segments are more likely to buy, which product features trigger aha moments, and where your sales team should focus their attention.
Let’s explore what you can learn from monitoring sales, which metrics you should track at each level of your organization, and how your sales data can inform your product development.
Why you should start monitoring sales now
The word “monitoring” should conjure the image of someone sitting at a wall of screens, keeping an eye on how everything is going, and pondering their next move.
So when we talk about monitoring sales, we’re referring to aggregating sales data into a dashboard with the goal of tracking performance.
How exactly you monitor sales will depend on where you sit in the company. High-level executives will monitor overall company sales performance from a bird’s eye view in order to guide sales and product strategy, whereas individual sales reps will monitor their own personal pipelines.
But monitoring sales isn’t just about tracking dollars coming into your company.
Sales monitoring helps you understand the health of your business, the health of your funnel, and where improvements can be made across the organization.
Some of the benefits of monitoring sales include being able to:
- Provide accurate forecasting at every level
- Set realistic sales targets (and exceed them, ideally!)
- Track individual and collective performances
- Identify pipeline strengths/weaknesses
- Segment, direct sales efforts (i.e. identify what makes a great product)
- Drive product insights
- Identify emerging themes
Ultimately, understanding your sales metrics help you discover opportunities for growth across your organization.
Sales metrics you should be monitoring
There are nearly infinite sales metrics you could track, but what metrics should you track? The answer will come with experimentation.
Every founder starts by tracking monthly (MRR) or annual recurring revenue (ARR) before starting to build a picture of the entire sales funnel with additional metrics.
Here are some metrics you should consider tracking as you build your sales monitoring processes.
Activity metrics (inputs)
Sales activity metrics are the actions your sales reps are taking. These are mostly quantity measures.
Activity metrics are the inputs or leading indicators to sales success.
They include the number of:
- Outreach messages
- Leads created
- Calls and conversations
- Social media connections
- Emails
- Discovery calls
- Meetings
- Demos
- Proposals
- Referral requests
Warning: Activity metrics can be a trap. Reps have very different styles. Some put a ton of “activity” work in to make sales, and others don’t. So quantity doesn’t always equal quantity, but it’s worth tracking activity metrics to identify sales patterns.
Core sales metrics (outputs)
Your core sales metrics are your actual sales numbers. These are the outputs of your sales processes and typically your KPIs.
Common sales metrics include:
- Total value of sales - i.e. monthly/annual recurring revenue
- Number of closed deals or contracts
- Number of logos - i.e. new companies closed
- Average contract value
- Quota attainment
Conversion metrics (efficiency)
Your conversion metrics measure how efficiently you move buyers through the sales funnel.
In many ways, these are the most informative metrics, as they’ll help you understand what’s working and what’s not at each stage of the buying process—allowing you to compare sales reps or customer segments.
Example efficiency metrics include:
- Conversion rate by funnel stage - e.g. MQL to opportunity
- Win/close rate - i.e. open vs. closed opportunities
- Sales cycle length
- Activity-to-close metrics - e.g. average number of conversations for won vs. lost opportunities)
- Profit margin
- Market penetration - i.e. how many customers you have compared to the total size of the market
Here, you need to analyze your conversion rates at different steps to see what’s working and not.
Other metrics to keep an eye on
Of course, there are many more categories of sales-related metrics you could track, including:
- Retention metrics: net promoter score, % new business, % existing customers, cross-selling and upselling, customer lifetime value (LTV)
- Lead generation metrics: number of opportunities added to pipeline, average response time, by lead source)
- Outreach and engagement metrics: send rate, open rate, response rate, engagement rate
- SaaS KPIs: customer acquisition cost, average revenue per user, churn rate
How to build a sales monitoring system
If you were hoping to monitor your sales from a spreadsheet—forget about it. There’s so much information changing in real-time that you should never rely on spreadsheets (unless you’re doing a quick one-off analysis).
What you want from a sales monitoring system is the ability to conduct real-time data analysis on how deals are progressing at various stages in various areas of your organization, and what factors may be impacting those deals..
This means integrating several systems into (ideally) one single-source-of-truth sales monitoring system.
Here’s what goes into building that system.
Your CRM
As a start, you should track your core sales data with a CRM—Salesforce and HubSpot being the most popular choices.
Regardless of which CRM you choose, they all have built-in sales dashboards that allow you to monitor the most common sales metrics and activities.
From your CRM, you can also build custom dashboards to track individual, team, and overall company performance.
This is a great start, however, it’s unlikely your CRM is going to do everything you need it to do out of the box.
First, your CRM won’t have all the data points you want—for example, data about how customers are interacting with your product.
Secondly, your CRM will only be compatible with certain data streams, i.e. tools that integrate nicely with your CRM of choice.
Finally, CRMs like Salesforce can be customized to do pretty much anything you want, but heavy customization normally comes with a heavy price tag.
So if you’re trying to build a truly predictive and informative sales monitoring engine, you’re going to need more than a plug-and-play CRM.
Additional data streams
What other data streams and tools may you want to include in your sales monitoring system?
For example:
- Gong and Chorus capture and analyze customer interactions (like calls or texts) to provide additional sales insights
- Dock tracks how and when prospects are engaging with your sales content
- Clari provides AI-powered sales forecasting
- Mixpanel tracks in-product analytics that can predict retention and churn
- HeadsUp combines CRM, product, and billing data to predict buying signals
When it comes to combining these data streams into a single source of truth dashboard, some of these tools, like Dock, will integrate with your CRM, but others may require you to use a business intelligence (BI) tool to build your own dashboard.
Business intelligence and dashboard tools
Using BI tools, you can build custom databases and dashboards that integrate these additional data streams.
There’s a wide range of options, including Looker, Mode, and Tableau.
These tools will give you near-infinite capabilities, but you’ll likely need a systems engineer to custom build a system to your liking.
Purpose-built sales management tools
Because it’s costly to build your own sales monitoring system, there’s a growing class of sales management tools that attempt to give you what you need out of the box.
Atrium, for example (shout out to Pete Kazanjy), integrates with common sales tools to provide dashboards that make it easier to track team performance against your sales KPIs.
Whether you take the BI tool approach or the sales management tool approach is up to you, but it’s unlikely that your vanilla CRM will do everything you need it to do.
Sales monitoring should look different at every management level
What your CRO needs to know about your sales data will be completely different from what a sales manager needs to know.
Therefore, the key to a strong sales monitoring system is to provide each management level with their own personally tailored sales dashboard.
Each dashboard will have essentially the same metrics, but there will be different degrees of rollups at each level in the organization.
Here’s a breakdown of what that looks like at each level.
What a CRO should monitor
A CRO will be interested in the entire organization’s sales performance. They’ll be looking at the data primarily from a strategic, high-level perspective.
Cohort analysis is extremely important at this level (more on this later), as their goal will be to notice patterns and compare segments to the mean.
For example, a CRO may notice that enterprise sales have a much lower close rate than SMB sales. They’d dig deeper into the data to figure out why, and come up with either a sales solution (e.g. adopt a new sales methodology) or product solution (e.g. provide more customization options) to address the poor close rate.
What a VP should monitor
A VP of sales is typically looking for similar patterns as the CRO, but within a single division. They normally have a team of two to three directors reporting to them across multiple segments or geographies.
They’d be looking for segmented patterns as well. For example, does one geography have higher average contract values? Or do certain product lines have faster time to close?
They could then decide to either invest more sales efforts in the high-performing areas or improve sales training for the weaker areas.
What a director should monitor
A director usually owns one sub-division of the sales organization—whether it’s a single product, customer segment (e.g. SMB), or geographic region. They likely have a team of two to three managers reporting to them, each with their own teams of account executives.
These directors will be most interested in the performance of management teams. Are some teams outperforming others? What are they doing differently in terms of sales activity?
Their dashboard would need to make these comparisons easy.
What a manager should monitor
Sales managers are invested in the performance of individual account executives within their team as well as the performance of the team as a whole.
They’ll be interested in sales metrics like average contract value and deal volume, activity metrics, and progress toward monthly and quarterly quotas.
Therefore, their dashboard needs to make it easy to compare individuals to the average and to identify winning behaviors from their top salespeople.
What an account executive should monitor
Account executives on the ground level are interested in monitoring their own personal pipelines. They want to know where their prospects are at in the respective deal stages, how many calls and demos they’ve held, and their own close rates.
They’re trying to answer questions like, “do I need to do more?” and “how’s my own performance?”
You can continue this all the way down to the most operational sales team members. In their case, their dashboards should help inform their day-to-day activities.
Cohort analysis drives insights
Key to this ability to provide the right dashboards to the right people is to be able to segment your sales data.
As you grow, cohort analysis becomes increasingly important to drawing meaningful insights from your sales data.
If you’re unfamiliar, cohort analysis refers to breaking your data into related groups in order to draw conclusions about differences or similarities between those groups.
As early as you can, you should separate your sales metrics by as many relevant dimensions as possible.
For example, you can segment your sales by:
- Product or service
- Previous products or services purchased
- Customer size
- Customer industry
- Customer role or job title
- Geographies or territories
- In-product customer behavior (e.g. which features cause users to stick)
- Lead acquisition source (e.g. referral or cold outreach)
- Sales managers/teams
For example, you may learn that you close law firms at a lower rate than you close tech companies. This could either drive you to stop targeting law firms, or to make adjustments to your product to better serve their needs.
You’ll also find insightful interactions between segments. For example, you may find that certain products perform better in certain geographies or that customers of different company sizes get their aha moment from different features.
As you learn more about how each cohort behaves, it will become easier to forecast sales.
Forecasting becomes more important as you scale
Sales forecasting is hard. That said, it’s worth investing effort into early—even as a startup.
On the most basic level, forecasting allows you to understand your revenue model and the health of your business. It gives you a solid handle on the inputs that drive revenue.
Each leader needs to be able to monitor their respective sales team to see how they are tracking against the forecast.
But on a longer-term scale, forecasting also helps you mature as a company—because mature companies demand sophisticated inputs, pipelines, dealflows, and revenue numbers.
Post-IPO, your investors will expect you to reliably predict how much revenue you’re going to close every quarter. Your credibility in the market will depend on it.
Accurate forecasting also has a positive ripple effect throughout your organization.
Your finance teams can more reliably create departmental budgets, your sales ops teams can more reliably set quotas, your marketing team can tailor their strategy to your lead targets, and so on and so forth.
The efficiency gains are enormous.
So as you scale, forecasting becomes really important.
Sales monitoring drives product growth
Understand your sales metrics isn’t just about predicting revenue. Getting a strong grasp on your metrics helps inform everything else about your business—especially your product.
This is especially true for tailoring your product to your ideal customer.
Back in 2014, investor Chris Janz wrote an influential blog, Five ways to build a $100 million business.
He followed it up in 2019 with Five years later: Five ways to build a $100 million SaaS business.
In the latter post, he describes the five “animals” you might be hunting as a SaaS business:

- Mice: 1 million consumers paying you $100+ per year each (e.g. Evernote, MailChimp). Growth is driven primarily through virality.
- Rabbits: 100,000 small businesses paying you $1k+ per year (e.g. Basecamp). Growth is driven through inbound marketing.
- Deer: 10,000 medium-sized companies paying you $10k+ per year (e.g. Lattice). Growth is driven by inbound marketing and inside sales.
- Elephants: 1,000 enterprise customers paying you $100k+ per year (e.g. Workday). Growth is driven by product-market fit.
- Whales: 100 enterprise customers paying you $1M+ per year (e.g. Salesforce, Zuora). Growth is driven by product-market fit (and lots of investment in your product).
As your startup evolves and your sales grow, you’ll have to figure out what type of animal you’re hunting.
You may start out by hunting rabbits, but move up-market to deer and elephants.
This is where sales monitoring becomes key. It’s unlikely you’ll only ever cater to one type of animal at a time—you’ll have a mix. By monitoring your deal and company sizes, you’ll quickly learn what type of animal you should target.
Not only will it inform your sales process, it will inform your product development.
This goes back to our discussion of cohort analysis. You may want to target enterprise elephants because of the big price tag, but your product may only be suitable for deer. So you’ll either have to either adapt your product, or adapt your sales strategy.
Product data is sales data
Especially for early-stage PLG companies, your product usage data is a key component of your sales data.
We’ve previously argued that even product-led growth companies eventually need sales teams to accelerate growth and move upmarket.
As you grow, your sales people need to be able to monitor product behavior to identify key buying moments or opportunities.
Historically, it was really hard to get your product data into a CRM for your sales team to be able to take action. Like we mentioned above, you’d have to push your sales data and product data into a database and visualize it in some way.
But now, there’s a whole new class of PLG companies who are trying to solve this.
Pocus, Endgame, and HeadsUp are just a few examples of tools that aim to identify product-qualified leads (PQLs) for your sales team.
With these tools, you can map out the “aha moment” (or moments) in your product that triggers users to take out their wallets.
The gold standard is being able to say what your close rates will be after users have done action X in your product versus users who haven’t done X, or who have done action Y. But it takes a lot of experimentation to get there.
These tools can also identify upsell opportunities for your sales team. For example, they can flag if there’s an influx of user sign-ups from the same company—a great opportunity to sell a team or enterprise account.
It’s best to incorporate these data streams into your sales monitoring process as early as possible, as they’ll teach you a lot about your sales process and your product.
Don’t be blind to buyer engagement
Sales reps used to have significant blind spots when it came to buyer engagement throughout the sales process.
You could track if there was an opportunity, and if the sales rep gave a demo, but there was a void of information in the time between those steps.
For example, did the buyer ever go back to your slides? Was the demo or proposal passed on to the boss? Are they doing the necessary internal follow-up?
There were very few signals to tell you how likely the deal was to close, making it difficult for sales reps to know where to spend their time.
Now, tools like Dock make it possible to track those “in between” times and pipe that data into your sales monitoring dashboards.
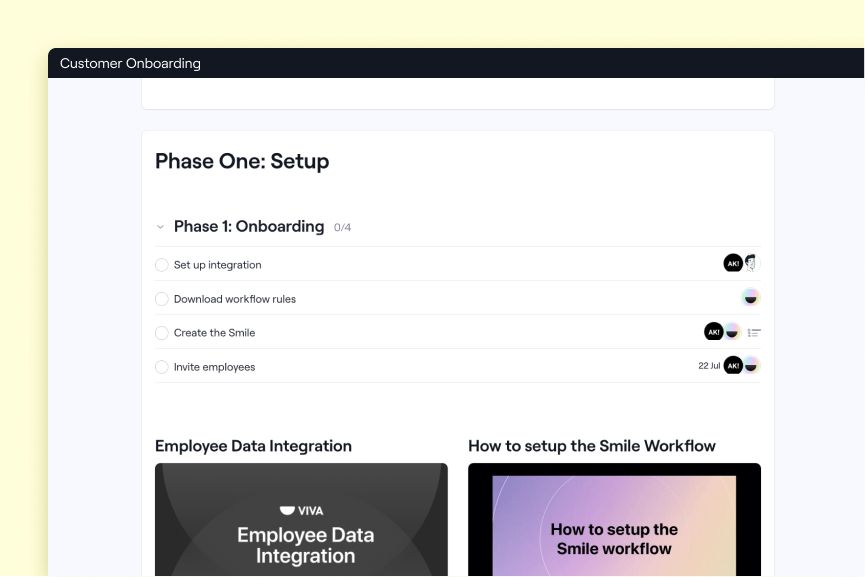
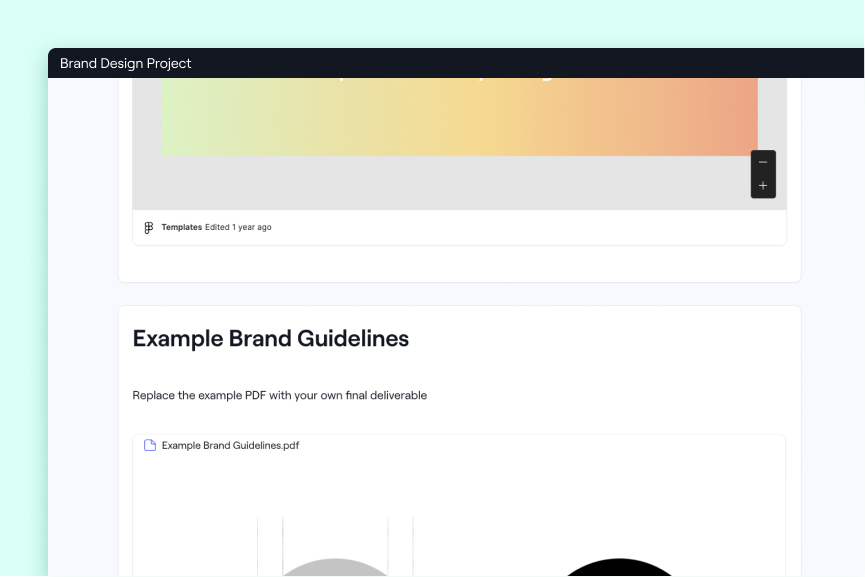
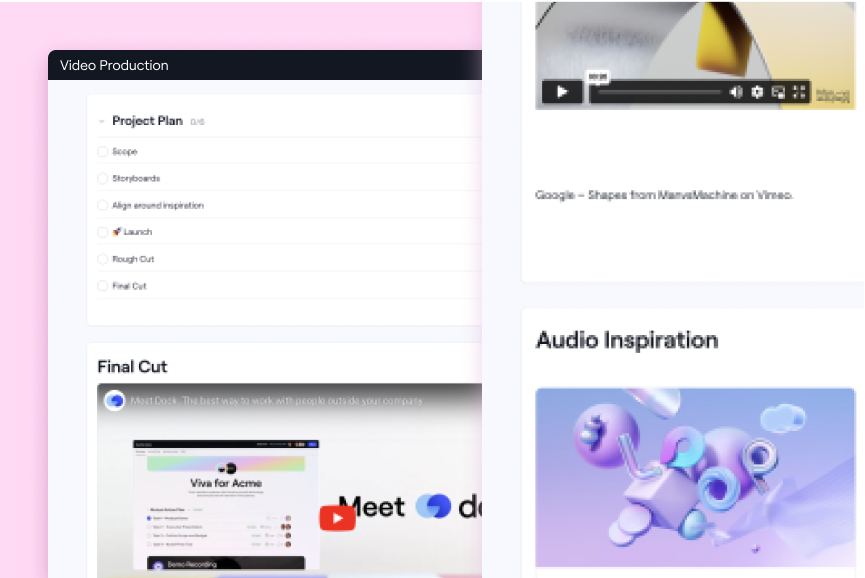
With Dock, you can build a customer-facing space that hosts all of your key sales materials, communication, and project timelines in one place. You can embed slide decks, mutual action plans, Loom videos, and anything else that helps you push deals forward.
For your client, everything is conveniently stored in one place, making for a much smoother buying experience.
For your sales team, Dock unlocks a treasure trove of buying signals:
- When and how often your buyer views your space
- Which buyer contacts view your space
- What content your buyer engages with
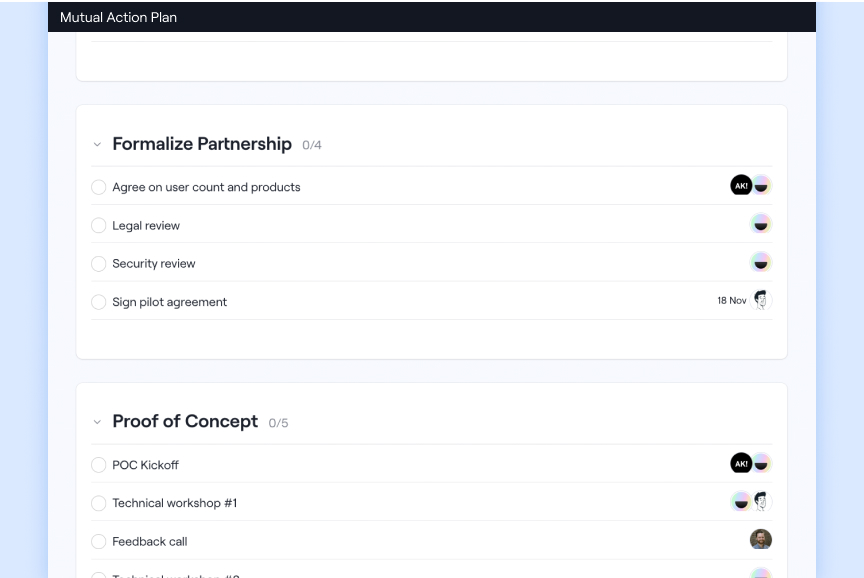
- How many steps are completed in your mutual action plan
- Time spent viewing PDFs or slides, including time per page
All this Dock data helps improve your forecasting engine. If prospects aren’t engaging with your Dock workspace, they’re not truly engaged—and your reps should spend their time elsewhere (or work harder to save the deal).
Mutual action plans are a key example. If your prospect hasn’t completed certain steps in the sales process that signal high intent, then they’re not going to close.
All of this data can be integrated into your CRM or BI tool to give you even greater sales monitoring capabilities.
How do I get started with Dock?
We'll start sending out invites to Dock to beta users in the coming days. If you're interested in using Dock, click here to request a demo.


Related Revenue Lab Articles

.png)


.png)
.jpg)
Templates for Sales, Onboarding,
Projects and Portals
Customize and share with clients