


“You’re the CMO of your product.” The CEO at my first product marketing job said it so definitively that the words stuck to me like a staple.
Because it’s true. Whether you’re a product marketer or startup founder, this is a hat you’ll wear at some point.
Ironically enough, most of the metrics you’ll track aren’t traditional “marketing analytics.” They’re product marketing metrics, which means they involve all revenue teams and span across the customer lifecycle.
Read on for an overview on how to measure your product marketing strategy, and how to leverage metrics to optimize your GTM and buyer experience.
How to Set Product Marketing Goals and KPIs
It’s easy to get caught in the tangled web of measuring everything. Especially in SaaS product marketing, where data flows like water.
How much is too much? When the information no longer serves your team or buyer.
When it comes to tracking our product marketing efforts, we should:
- Be data-driven, not “data-obsessed”
- Think big picture, but be ready to zoom in to the account and contact level
- Set forward-looking product marketing goals instead of only looking backward

Don’t track metrics until you set goals
Goals are like hypotheses. They give us a framework for testing ideas. This is especially important when you’re starting out and don’t know what “good” looks like. You might not have a neat Salesforce dashboard with all the data you need at your fingertips.

Goals serve as guideposts. We can measure against them through the lens of leading and lagging indicators.
- Leading indicators help us make predictions about the future. For example, getting 500 podcast subscriptions from people that fit our ideal customer within 6 months could contribute to an X% increase in pipeline.
- Lagging indicators are influenced by leading indicators, and they assess the current state of the business. A few examples are revenue, average deal size, or win rates.
As product marketers, startup founders, and CMOs, we’re on the hook for lagging indicators. How do we steer the ship in order to get there?
Objectives, Key Results, and Projects
Here’s what Jason Oakley, Founder of productivepmm.com (and my previous manager), recommends:
"For me, the focus of product marketing is constantly shifting to address different needs across the org. That's why I like aligning metrics to specific business or department objectives that may change quarter to quarter, in addition to constant North-Star metrics like competitive win rate, pipeline, and revenue.
"Within that, I like to think of Objectives, Key Results, and Projects:
- Your Objective can be a qualitative goal like, "enable our sales organization to confidently pitch our value to the executive audience."
- Your Key Results could be a quantitative goal like, "reach 85% sales confidence in delivering this message” or “reach 100% adoption across the AE team"—measured by whether or not reps have used this messaging in an executive conversation by EOQ.
- Your Projects are the work that lead to the key results like, "completed 4 enablement training sessions and certified every AE on the team."
Jason goes deeper on OKR examples in this LinkedIn post.
The MAYO Framework
Another great framework is one I adapted from my time as a Senior Product Marketing Manager at Chili Piper. I call it the “MAYO framework”:
- Motions: the different go-to-market strategies used to get the product in front of customers (e.g., demand gen, channel partnerships, events)
- Actions: the specific activities to execute on each quarter, organized under motions. (e.g., publish two blog posts, launch one partner marketing campaign, host three in-person dinners)
- Yield: the results you expect, or predict, each action to generate (e.g., five booked demos)
- Outcomes: the actual outcomes of each action (e.g., 37% increase in ACV)
What I love about this template is that it gives you a birds-eye view of your GTM plan, but also breaks it down to the individual level.
Attributing outcomes to specific actions is a whole other can of worms, but we covered it briefly in this product marketing tech stack guide.
Revenue Metrics
Goals help measure success and rally your team, but the C-suite and board want cold, hard revenue numbers. Standardized metrics are a common love language because they usually don’t lie.
Without boiling the ocean, here are the ones to pay close attention to. Most are worth cutting by industry, segment, or persona to get deeper insights.
1. Recurring Revenue
Revenue is typically measured as annual recurring revenue (ARR) or monthly recurring revenue (MRR), especially for a SaaS startup. This is the lifeblood of your business.
2. Customer Acquisition Cost (CAC) Payback Period
The CAC payback period is the time it takes to recover customer acquisition costs. It is a signal of a company’s future profitability and also teases out marketing channels that aren’t effective.
CAC payback period =
Total Marketing and Sales Spend in Given Period /
(New MRR * Gross Margin)
If you haven’t looked at this number before, it might be difficult to benchmark how well you’re doing. In OpenView's 2021 Financial & Operating Benchmark Report, they break down what it takes to be “best in class” at each funding stage. If you nerd out on this stuff, they also compare CAC payback periods for PLG companies vs non-PLG.

CAC payback period is also a key metric used to evaluate product marketing’s performance.
Mikus Krams, Co-Founder of Trace.Space, puts it this way:
“I look at how quickly people move through the funnel and how well the messaging resonates with the prospects. If people ask questions like ‘what do you do?’ it means product marketing performed poorly.
"From a practical perspective, it could be metrics like:
- How much shorter did the sales cycle get since product marketing was put in place?
- Was product marketing able to reduce CAC payback period since joining?”
3. Average Contract Value (ACV)
Also known as average deal size, ACV is the average amount of revenue a business receives from a customer in any given year.
Average contract value =
Total Revenue from all Deals / # of Deals
You can improve this metric by changing pricing, selling in more licenses early on, or upselling and cross-selling.
4. Average Revenue per User (ARPU)
ARPU is how much revenue you generate per active end-user in a given time period. It’s usually measured at a monthly level (MRR).
Average revenue per user =
MRR / # of Active Customers
This is an important metric in determining if you’re ready for scale. If ARPU is too low, you won’t be able to afford the growing pains of hiring for customer support or building a marketing team.
5. Customer Lifetime Value (LTV)
LTV, or CLV, measures the total revenue a customer will generate for a company before they churn. This helps determine what a business can afford to spend on acquiring and retaining customers.
Customer lifetime value =
ARPU * Gross Margin * Customer Lifespan
That’s why LTV/CAC ratio is a common metric used to describe the unit economics of a business. However, the number is only useful in the context of factors like time period or segment, as Ryan Rouse explains in this LinkedIn carousel.
6. Net Dollar Retention (NDR)
Today, most SaaS startups and investors look at Net Dollar Retention (NDR), as their North Star.
NDR is the amount of revenue you retain and expand in your existing customer base. This is a key metric because it shows if your customers are happy and if you’re able to grow the accounts you already have.
Net Dollar Retention =
(Revenue from Existing Customer Base + Expansion - Downgrades - Customer Churn) /
(Revenue from Existing Customer Base - Customer Churn)
7. Qualified Pipeline
My favorite definition for qualified pipeline comes from Mutiny: “the dollar value of all the open deals that the sales team is actively working to close”. It’s a unifying metric that sales and marketing agree on.
Number of Qualified Opportunities x Estimated ACV of Each Opportunity
Product marketers use this metric to see if their inbound and outbound efforts are paying off. It shows if SDRs able to book demos, or if marketing campaigns are bringing in the right person.
8. Pipeline Velocity
Also referred to as sales velocity, pipeline velocity measures how fast deals are moving through your funnel to closed won.
Product marketers should measure this metric because it shows how effective your positioning, messaging, and go-to-market strategy are in closing deals.
Pipeline velocity =
(Win rate % * Average Contract Value * # of Qualified Opportunities) /
(Sales Cycle Length or Days in Given Period)
Chris Walker from Refine Labs breaks down the formula in this 5-minute video. An important point he makes is that this metric includes many of the lagging indicators contributing to revenue.
If your win rate is low and your sales cycle is too long, velocity is slow and it’ll be tougher to close deals.
How to Measure Revenue Metrics
The data likely exists in your CRM or MAP, so it’s usually a matter of wrangling it together and making sure it’s accurate.
Tools like Hubspot, Maxio (previously SaaSOptics and Chargify), Mode, and Salesforce provide a central destination for crunching these numbers. If you’re not a wiz, just ask your RevOps or marketing operations team for help.
So now you have KPI dashboards filled with fancy metrics. What do you do with them?
Use it to “diagnose” your business or product line. Understand what levers to pull and what areas of the business to focus on.
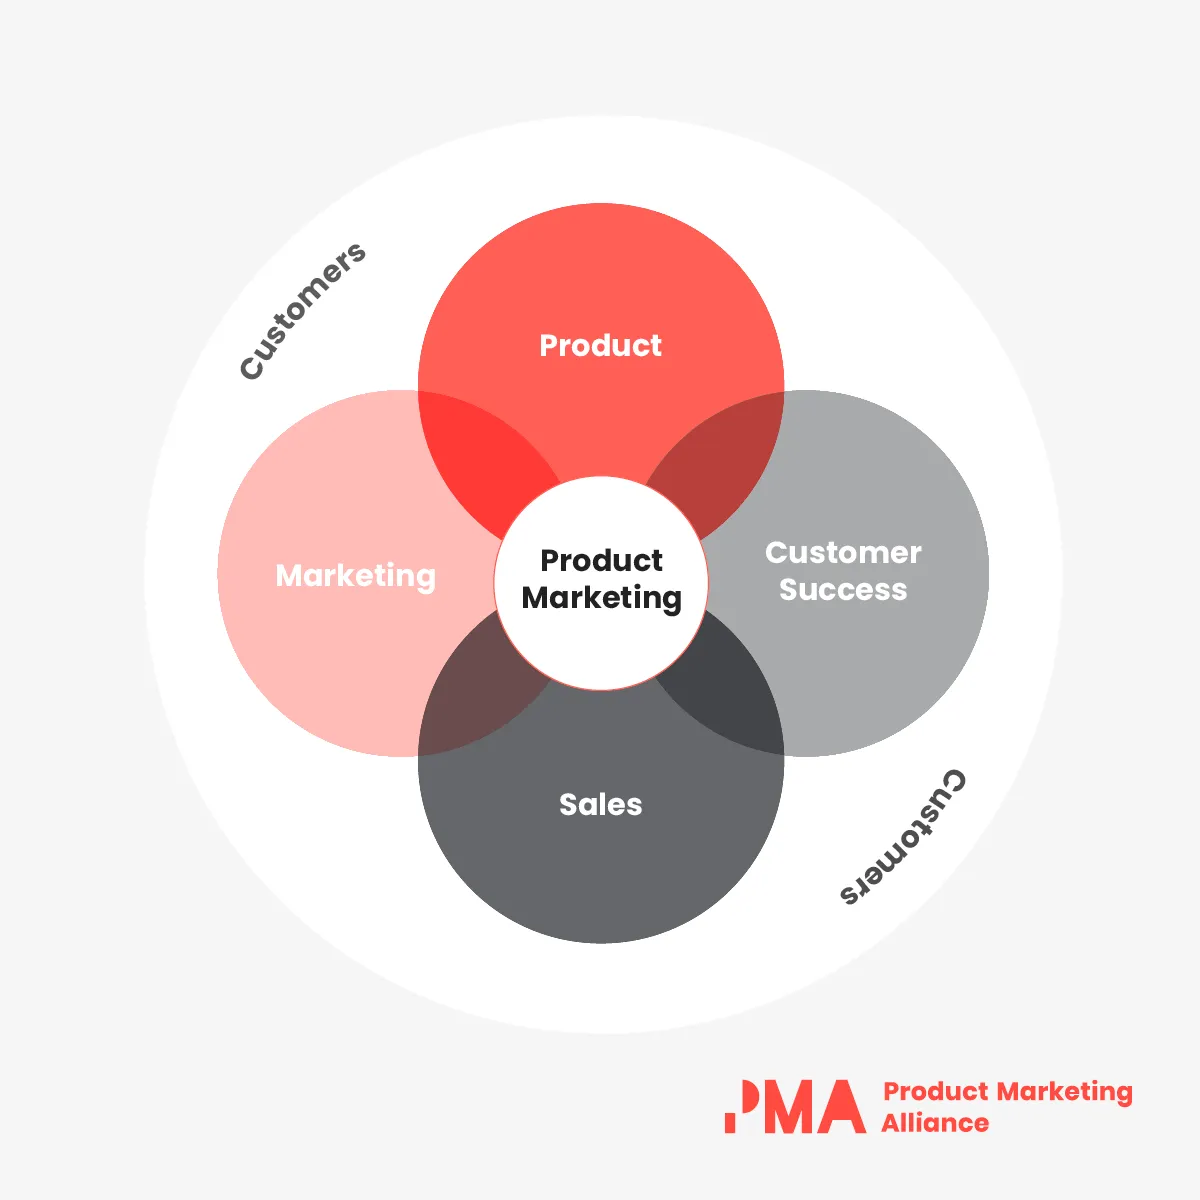
We’re looking for clues on how our revenue teams can close more deals and retain customers better. After all, enabling product, marketing, sales, and customer success to create a better customer experience is what product marketers do.
That’s why we’ve organized the following product marketing metrics by revenue team.
Product Metrics
Your product team wants to know how prospects and customers experience your product.
- Who likes the product most and who doesn’t?
- Where are users getting stuck?
- How do they use the product?
You can help them make data-driven decisions about product launches and roadmap by providing insights into customer behaviors and conversations.
The way teams measure the following metrics varies greatly on their GTM motion, stage of maturity, and structure, so we’ll focus on the key ones.
9. Free Trial Signup Rates
Understanding how many website visitors are signing up for your free trial guides product positioning, benefits, and features. This is a shared metric for product marketers and product managers because it shows if your offer and product entice visitors to become users.
Free trial signup rate =
# of Free Trial Signups / # of Unique User Sessions
10. Activation Rate
Activation rate is a measure of how many users complete a certain event. Many product-led companies focus on the “aha” moment, the time at which a user gets value from the product.
It’s also often when a user is considered to be a product-qualified lead (PQL).
Activation rate =
Number of Users Who Reach “Aha” Moment / Numbers of Users Who Signed Up for Trial
This metric helps you figure out where users are getting stuck, and look for ways to educate or motivate users to make it to that milestone.
11. Product-Led Conversion Rates
It’s great that someone came to your site, signed up for a trial, and got some value out of your product. But you have to convert these users into customers if you want to generate revenue.
PQL conversion rate =
Number of accounts converted from PQLs to paying customers /
Total number of PQLs
Measuring how many people go from free trial to purchase provides insight on if the customer sees enough value in the product to justify the price.
12. Product Usage Frequency
Product usage frequency looks at how often users engage with your product over a period of time. This varies significantly based on the market you serve, but the main categories include:
- Active users: you’ll usually see this reported as daily active users (DAU) or monthly active users (MAU). It defines the number of active users in a specific timeframe.
- Feature adoption: this type of data measures the usage of specific features, offering insight on what to prioritize. A quick way to measure feature adoption is to take a small sample of leads or customers and categorize their use case in a spreadsheet. This will help you understand how users are leveraging the product.
13. Churn Rate
Churn rate shows how many customers are dissatisfied with the product.
I personally don’t think net promoter score (NPS) is a helpful metric to track because it’s usually based on a singular question, like “would you recommend this product to a friend?” It’s not as actionable as monitoring observed behavior.
Churn rate is a great indicator that the product has a lot of bugs that need to be solved. Or, if expectations need to be changed.
Churn Rate =
# of Users that have Churned / # of Users
How to Measure Product Metrics
Aligning on important key performance indicators (KPIs) with your product team early on positions you as a leader, and helps them make data-driven decisions on how to improve the product and update the roadmap.
Most product metrics can be measured in platforms like FullStory, Heap, MixPanel, Pendo, or Pocus.
Marketing Metrics
Everything in marketing, especially now, is evaluated under a three-word microscope: Return on investment, or ROI.
Marketing-sourced pipeline, revenue, and expansion are the trifecta, but they’re only useful if tied to leading indicators your team can make progress towards.
To accurately track the team’s efforts, we need to set context and KPIs.

For example: “we expect a 20% increase in inbound pipeline within three months if we run an integrated campaign about revenue enablement. Inputs include two video ads, a blog post, and a community partnership.”
To put this into practice, here’s a case study on how we do this at Dock today.
Dock’s Content Lead, Eric Doty, explains why Dock measures its marketing success by looking forward at content production and results targets instead of backward at past performance.

The more specific we get about our goals and KPIs, the easier it is for your team to know how well they’re performing and what they could be doing better.
14. Return on Engagement Initiatives (ROEI)
With the rise of field marketing, evangelism, and community, “social engagements” can be a lot more than just likes and comments. That’s why a metric like ROEI is helpful.
ROEI measures the value companies receive from investing in engagement activities like social media, events, podcasts, and communities.
Return on engagement initiatives (ROEI) =
Value Generated from Engagement Initiatives / Investment in Engagement Initiatives
Value generated is tough to ascribe a dollar amount to, but it could be an estimate of new leads, deals, and lift in customer retention.
15. Cost Per Acquisition (CPA)
CPA is the amount of money it takes to acquire a new customer. Breaking this down by persona or company size can help you determine which customer segments to focus on.
Cost per acquisition (CPA) =
Total Costs associated with Acquiring Customers / Total Number of New Customers Acquired
16. Conversion Rates
Conversion rates measure the percentage of website visitors or leads who take a desired action, such as booking a demo or subscribing to a podcast.
As Emily Kramer, Co-Founder of MKT1, explains, conversion rate is a crucial lever that can generate high impact with a relatively low level of effort. That’s why conversion rate optimization (CRO) has become such an important discipline in marketing.
Conversion rate =
Number of Conversions / Number of Website Visitors or Leads
17. Content Performance
All product marketers should keep a pulse on their top-performing content.
How your content performs isn’t just a marketing metric because it impacts the rest of the business. Communicating what messaging and content performs best with your revenue team enables them to drive results across all customer engagements.
If a prospect is viewing your pricing page or reviewing a pitch deck at midnight, that’s a signal that prospect should be taken seriously. The problem is, there’s usually no way to track this activity at the lead or contact level.
Most content management systems (CMSs) only show aggregate data.
That’s why Dock launched a new Content Management platform built to help Product Marketing collaborate better with Sales.

Instead of guessing what content your champion is checking out, you can see their behavior in real-time. This arms your entire revenue team with the information they need to answer questions and push deals to the finish line.
18. Organic Traffic
Organic traffic is typically measured as the number of unique visitors coming to your website. It’s often looked at month-over-month and shown as a percentage increase.
Organic traffic % increase =
(Visits from Month 2 - Visits from Month 1) / Visits from Month 1
As Kirsten Burke, Founder of who raised?, puts it, “understanding how much high-value traffic my initiatives yield allows me to make decisions on whether or not to keep pouring time into SEO”.
If organic traffic is low, product marketers can work with their content team to publish blog posts or improve the site from a technical SEO perspective.
How to Measure Marketing Metrics
Higher-level metrics like ROEI and CPA will likely come from your CRM or marketing platform (e.g. Hubspot), but the rest can be found in analytics tools like Dock, HotJar, Google Analytics, and Google Search Console.
Sales Metrics
Sales managers and reps want to feel enabled and empowered to sell more and sell faster.
If you’re able to share ways to improve the selling process with supporting data, you’ll become their best friend. So what should you look at?
19. Win Rates and Reasons
Win rates measure the percentage of sales opportunities that result in a closed won deal.
Win rate =
Number of Closed Won Deals / Number of Total Opportunities (Closed Won and Closed Lost)
The number alone is a signal if your positioning is clear and sales is doing a good job converting.
However, it’s even more useful when combined with a reason. One way to collect this data is by adding a Salesforce field called “Closed Lost Reason”.
If you see that multiple reps are citing one competitor or a specific feature that’s missing, you might develop sales enablement materials or train the team on a new talk track.
20. Average Sales Cycle Length
We mentioned this earlier when talking about pipeline velocity, but sales cycle length looks at how long it takes for a rep to close a deal from first contact to final signature.
Avg. Sales Cycle Length =
Total Sales Cycle Length / Total Number of Deals
Shorter sales cycles indicate higher sales confidence and efficiency.
21. Sales Content Utilization
You just spent 30 hours on a pitch deck. Did your reps actually use it in sales conversations? That’s what sales content utilization seeks to measure.
Sales content utilization =
Number of deals where content was used / Total number of deals
But that’s not easy to do when you’re emailing over a PDF. That’s where Dock’s Content Management platform can help:
- Internally, you see what sales content your reps are using on each deal (and what content they’re never touching).
- Externally, you get visibility into which assets prospects are engaging with most. For example, you’re able to track what page of a PDF gets the most views, or where dropoffs happen. This helps you determine what messaging is resonating best with your buyers.
How to Measure Sales Metrics
Many traditional sales metrics live in Salesforce, but others can be found in sales enablement tools like Dock, Guru, or Seismic.
Customer Success and Account Management Metrics
Product marketers are responsible for helping retain customers, not just acquiring them.
Remember when we said net dollar retention (NDR) is the metric most startups and investors look at these days? Customer success (CS) and account management teams are key players in improving NDR, yet they’re often overlooked by product marketers.
From a business fundamentals standpoint, it’s just smart to focus on retention. The cost of acquiring a new customer is almost always higher than keeping one.
That’s why it’s crucial to evaluate “downstream” metrics.
22. Expansion Revenue
This measures the dollar amount of revenue coming from upsells and cross-sells.
Expansion revenue =
(Total Revenue - New Business Revenue - Renewal Revenue) /
Renewal Revenue
Although CS and account management teams typically own this metric, customer marketing and events can play a big role in helping drive expansion revenue.
23. Time to Value (TTV)
Time to value (TTV) measures how long it takes for an average user to reach an activation milestone.
Time to value =
Average Date of Activation - Average Date of Signup
A strong onboarding experience can drive TTV down by making it easier for users to get started with a product. The problem is, most onboarding experiences today make it hard.
Instead of sharing messy spreadsheets, checklists, and emails, use a Dock onboarding workspace.

💡 Tip: Dock’s customer onboarding template helps CS and implementation teams deliver a great first impression. Use it to guide customers through the kick-off process, host interactive resources, and get real-time analytics in a shared workspace. No more countless follow-ups on email threads.
How to Measure Customer Success Metrics
Along with Salesforce reports, you can use ChurnZero, Gainsight, or Planhat to dig deeper into customer success metrics.
Dock is your Revenue Team’s Best Friend
Just because you can measure something doesn’t mean you should.
As you continue to optimize your GTM, we hope you’ll focus on metrics that serve your revenue teams and buyers better.
If you feel like your sales cycle length or TTV is too long, consider using Dock. It’ll help you and your reps remove friction from the buying process and create customer relationships that last.
Dock is free to try for up to 5 workspaces. To learn more, get a demo from our sales team or get started for free here.


Related Revenue Lab Articles


Templates for Sales, Onboarding,
Projects and Portals
Customize and share with clients


