


Dock’s new Reports give revenue leaders a bird’s eye view into customer engagement across sales and onboarding.
Dock now has four built-in reports that help you answer big questions about your customer lifecycle:
- Client Engagement: How actively are customers engaging with your workspaces?
- Team Usage: How actively is your team using Dock?
- Sales Impact: What impact does Dock have on your pipeline, close rates, and time to close?
- Implementation Status: How long are customer implementations taking?
These reports help your team understand the impact of your Dock workspaces, uncover wins, and find areas for improvement.
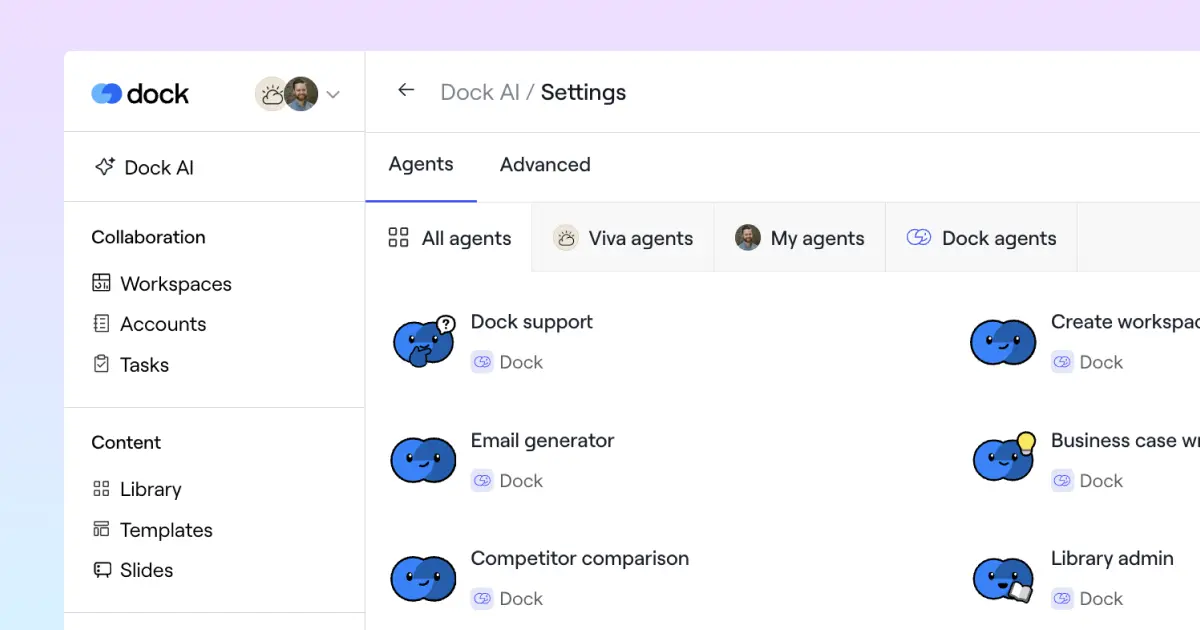
The new reports are available from the Reports tab on your Dock dashboard. Each report is filterable by date range, workspace owner, and/or team to really help you drill down into the data.
Keep reading for a quick breakdown of each report.
Track client engagement
The Client Engagement report shows you customer activity across all your Dock workspaces.
This report tracks how well you’re multithreading accounts, helps you identify champions, and lets you track trends in engagement over time.

Here, you’ll see:
- Total client views
- Total client actions
- Average unique clients per workspace
- Client views over time
- Most engaged clients
💡Dock tip: Click one of the metrics tiles to pull up a complete list of accounts and their engagement.

For more info on the Client Engagement report, see our Help Center.
Track your team’s Dock usage
The Team Usage report shows you internal activity across all your Dock workspaces. This report helps you see which team members are making the most of Dock and who may need some extra encouragement.

Here you'll find the following insights:
- Total workspaces created
- Workspaces by owner (i.e. team member)
- Views and actions by owner
💡Dock tip: Filter by Owners to limit the usage graph to a single team member.
For more details on the Team Usage report, see our Help Center.
Track Dock’s sales impact
The Sales Impact report shows buyer engagement and impact on revenue performance across all your sales rooms.
This report combines your CRM data with Dock workspace data to show you the impact Dock has on your pipeline and close rates.

Here, you’ll see reports on:
- Sales impact: Total deals, pipeline, and revenue touched, closed won deals, close rate, and average days to close
- Buyer engagement: Views, actions, and average buyers per workspace
- Most engaged buyers
This can give you a much better sense of how well your team is multithreading deals, how much revenue your sales workspaces are touching, and how your workspaces impact close rate.
💡Dock tip: To populate this report, remember to set the workspace type for your sales workspaces from the Settings in the workspace’s Internal tab.
See our Help Center for more info on the Sales Impact report.
Track implementation progress
The Implementation Status report shows activity across all your Dock onboarding workspaces.
This report lets you track how engaged your customers are during what’s arguably the most important phase of the customer journey. If they have a bad implementation experience, they will churn.
This report helps you measure how long your implementation process actually takes and lets you identify at-risk accounts early on.

Here you'll find the following insights:
- Total, active, and completed implementations
- Average time to completion
- % of implementations completed on time
- Implementations started over time (graph)
- Implementations by owner
- Customer engagement: views, actions, and average unique customers
- Most engaged customers
💡Dock tip: To see your most- or least-engaged implementations, click one of the implementation metrics and then sort by Customers Engaged, Views, or Actions.

Important note: The Implementation Status report relies on the Key Dates in your workspaces. See our Help Center for more info on setting these up.
With more reporting capabilities coming soon
These new Reports, in combination with last week's Workspace Views launch, give revenue leaders way more visibility into what's happening in Dock.
We’re treating Reports as a beta launch, but we really wanted to get these out into the wild. We'll be making constant tweaks and improvements over the next few months, so we’d love to hear your feedback as you start working with them. Just reply to this email or shoot us a note at support@dock.us.
Those of you who are extra astute may have noticed we also just launched a Content Influence report. But more to come on this later...


Related Revenue Lab Articles
.jpg)
.webp)


Templates for Sales, Onboarding,
Projects and Portals
Customize and share with clients


